Goal Distributions, Part 3: Home vs Away
- Emmeran J

- Sep 14, 2024
- 2 min read
In this third post looking at goal distributions, we focus on the difference between home and away.
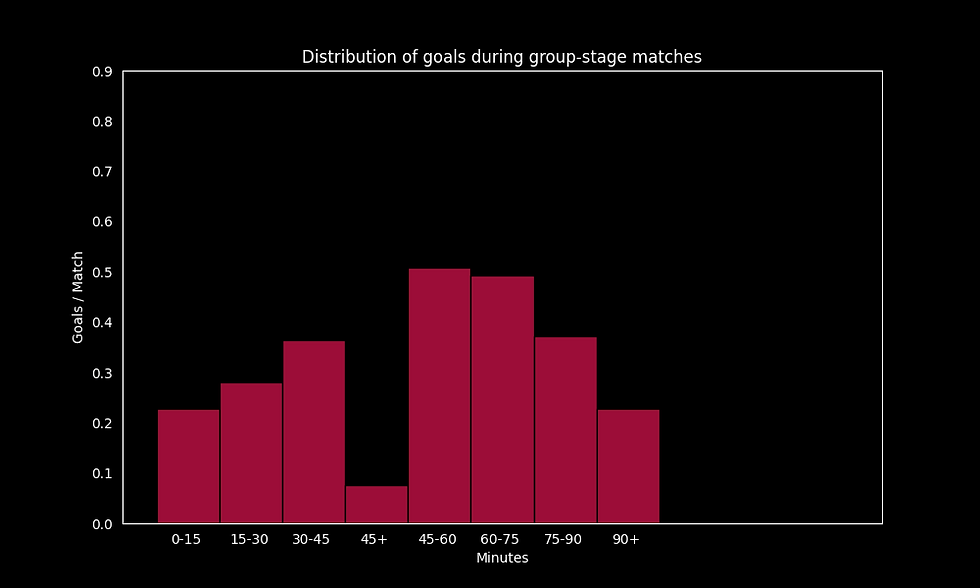
First up, we consider a similar interactive histogram as in part 2 but with the additional option to visualise goals by home and away teams separately.
The notion of home advantage in football is very well established and indeed this is reflected in the data through the histogram above: for almost every single minute of a match, home teams have on average scored more goals than away teams. However, the key question remains: Is this difference statistically significant, or could it be attributed to random variation, which is inherent in both football and the data we’ve analyzed?
We first focus on the number of goals scored by home or away. To carry out a statistical test, we will make some assumptions about the data. We assume that the number goals scored by a team during a match follows a Poisson distribution (and implicitly that the length of all matches are the same) and that they are independent and identically distributed. We further assume that there is a single Poisson distribution governing the goal counts for all home teams and another for all away teams. The aim is to test whether the rate parameter of the Poisson distribution is the same for both home and away teams. Although these assumptions may not hold perfectly in practice, they enable us to conduct a Poisson rate test, which can provide meaningful insights. The p-value for the test is 1e-21 suggesting very strong evidence against the null hypothesis that the rates are the same. Under our assumptions, we can confidently say that there is a statistical difference between the goal scoring rates of home and away teams.
Ok, so home teams score more goals, but is there a difference in the way their goals are distributed throughout the match compared to away teams. This is a question not about the absolute number of goals but about their distributions. To test for this, we use the Mann-Whitney U test, a non-parametric test that only assumes the data points (goal timings) are independent and can be ranked (i.e., we can compare whether one goal minute is greater or lesser than another). The p-value of the test is 0.93 so there is no evidence to suggest that the distributions of when goals are scored is different for home and away teams.
In summary, while home teams score more goals than away teams, the distribution of these goals across the minutes of a match appears to be similar for both groups.
The interactive plot was created using the python library plotly (and dash) and it is hosted online through render.com. The code is available on my github.
As always, I am very much learning as I go with these interactive plots so please let me know if you have comments / feedback / suggestions. Thanks for reading!

Comments